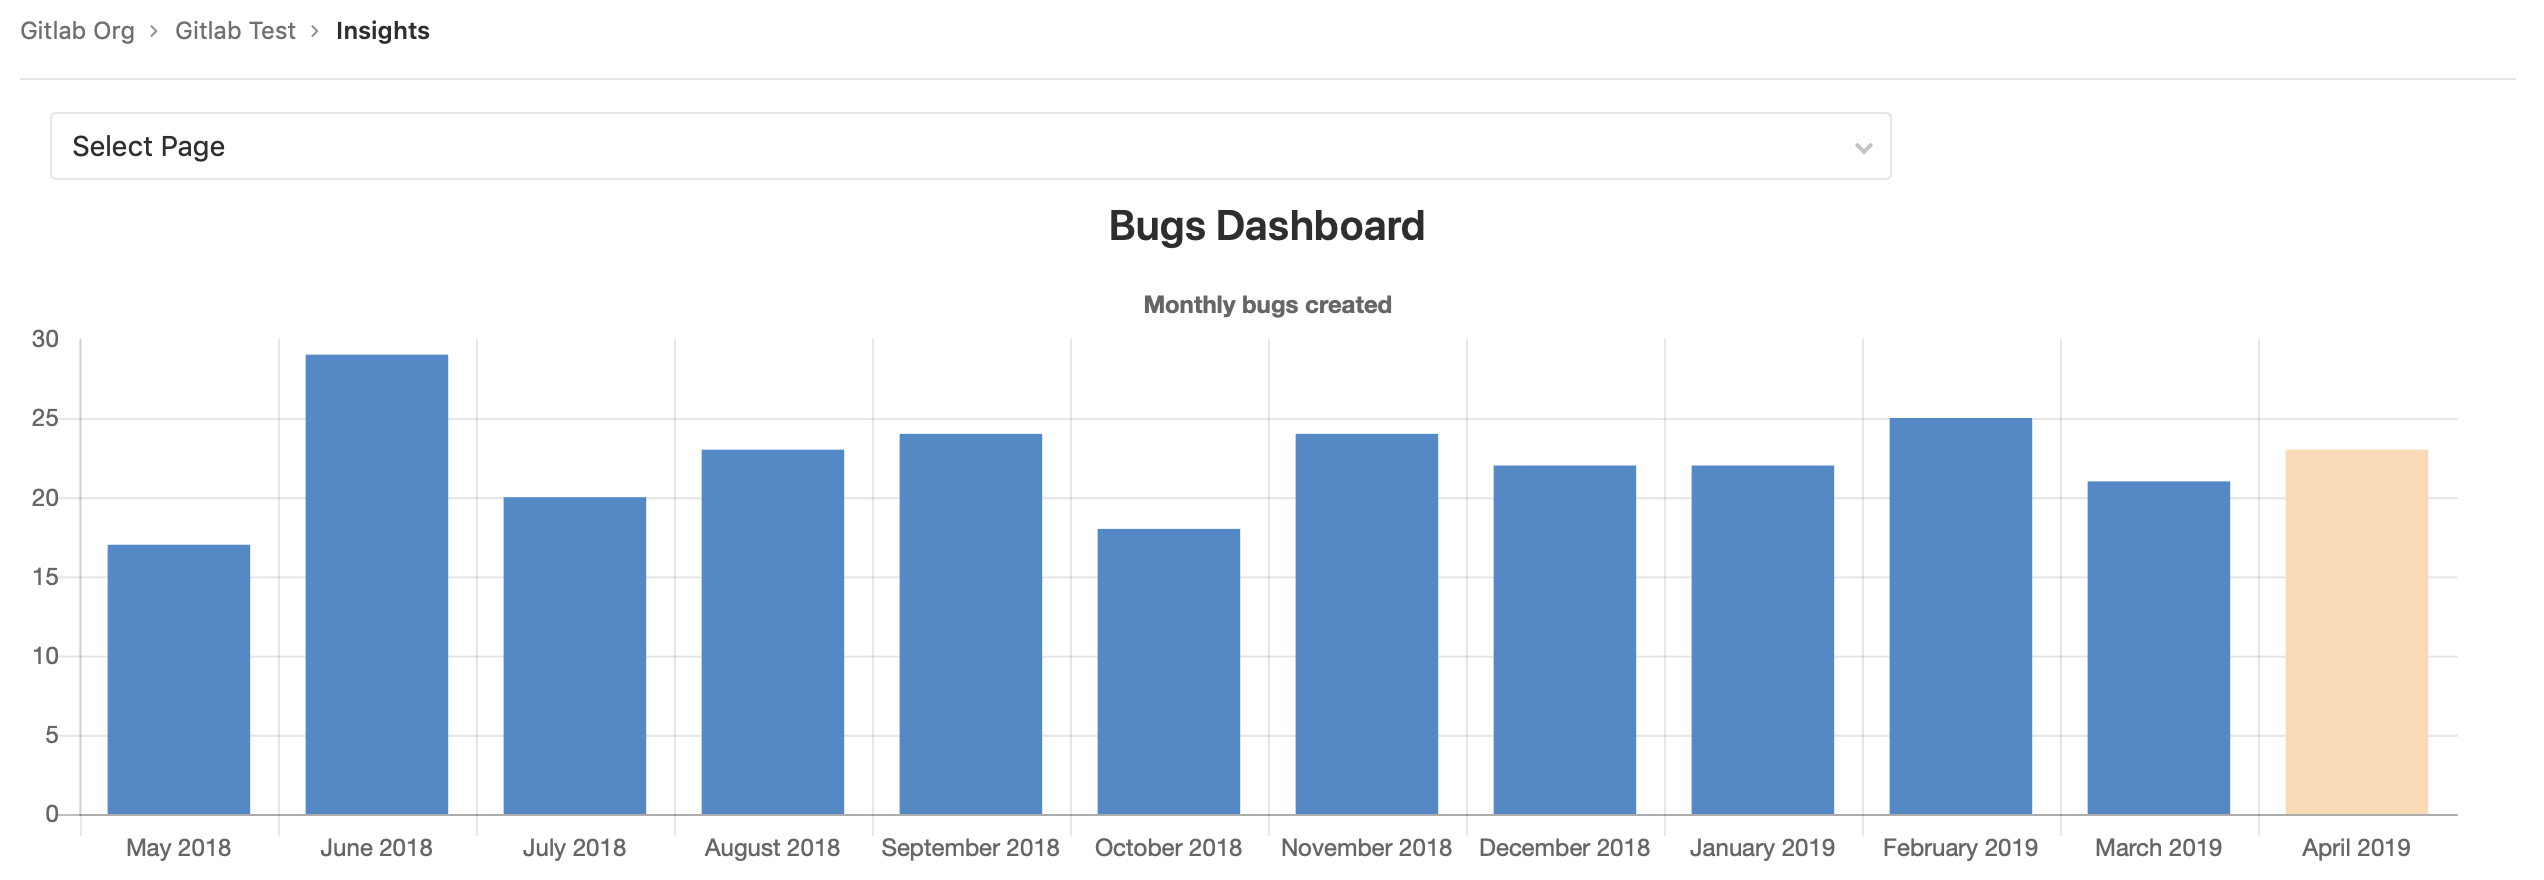
Insights (ULTIMATE)
Introduced in GitLab 12.0.
Configure the Insights that matter for your projects to explore data such as triage hygiene, issues created/closed per a given period, average time for merge requests to be merged and much more.
NOTE: This feature is also available at the group level.
View your project's Insights
You can access your project's Insights by clicking the Analytics > Insights link in the left sidebar.
Configure your Insights
Insights are configured using a YAML file called .gitlab/insights.yml within
a project. That file is used in the project's Insights page.
See Writing your .gitlab/insights.yml below
for details about the content of this file.
NOTE: After the configuration file is created, you can also use it for your project's group.
NOTE: If the project doesn't have any configuration file, it attempts to use the group configuration if possible. If the group doesn't have any configuration, the default configuration is used.
Permissions
If you have access to view a project, then you have access to view their Insights.
NOTE: Issues or merge requests that you don't have access to (because you don't have access to the project they belong to, or because they are confidential) are filtered out of the Insights charts.
You may also consult the group permissions table.
Writing your .gitlab/insights.yml
The .gitlab/insights.yml file defines the structure and order of the Insights
charts displayed in each Insights page of your project or group.
Each page has a unique key and a collection of charts to fetch and display.
For example, here's a single definition for Insights that displays one page with one chart:
bugsCharts:
  title: "Charts for bugs"
  charts:
    - title: "Monthly bugs created"
      description: "Open bugs created per month"
      type: bar
      query:
        data_source: issuables
        params:
          issuable_type: issue
          issuable_state: opened
          filter_labels:
            - bug
          group_by: month
          period_limit: 24
Each chart definition is made up of a hash composed of key-value pairs.
For example, here's single chart definition:
- title: "Monthly bugs created"
  description: "Open bugs created per month"
  type: bar
  query:
    data_source: issuables
    params:
      issuable_type: issue
      issuable_state: opened
      filter_labels:
        - bug
      group_by: month
      period_limit: 24
Configuration parameters
A chart is defined as a list of parameters that define the chart's behavior.
The following table lists available parameters for charts:
| Keyword | Description |
|---|---|
title |
The title of the chart. This displays on the Insights page. |
description |
A description for the individual chart. This displays above the relevant chart. |
type |
The type of chart: bar, line or stacked-bar. |
query |
A hash that defines the data source and filtering conditions for the chart. |
Parameter details
The following are detailed explanations for parameters used to configure Insights charts.
title
title is the title of the chart as it displays on the Insights page.
For example:
monthlyBugsCreated:
  title: "Monthly bugs created"
description
The description text is displayed above the chart, but below the title. It's used
to give extra details regarding the chart, for example:
monthlyBugsCreated:
  title: "Monthly bugs created"
  description: "Open bugs created per month"
type
type is the chart type.
For example:
monthlyBugsCreated:
  title: "Monthly bugs created"
  type: bar
Supported values are:
| Name | Example |
|---|---|
bar |
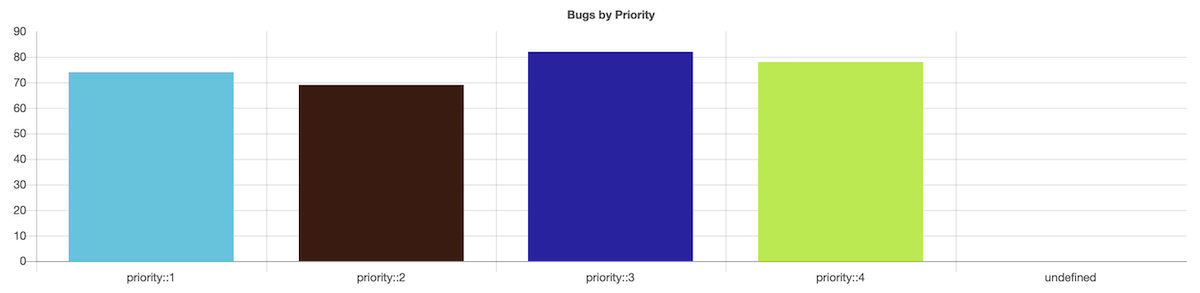 |
bar (time series, that is when group_by is used) |
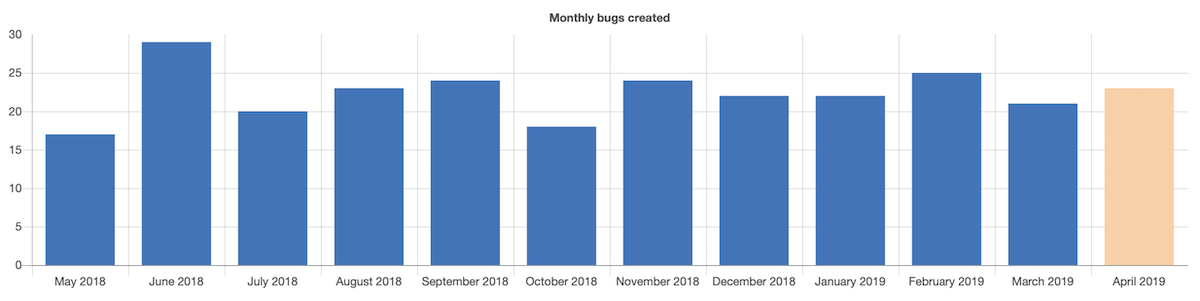 |
line |
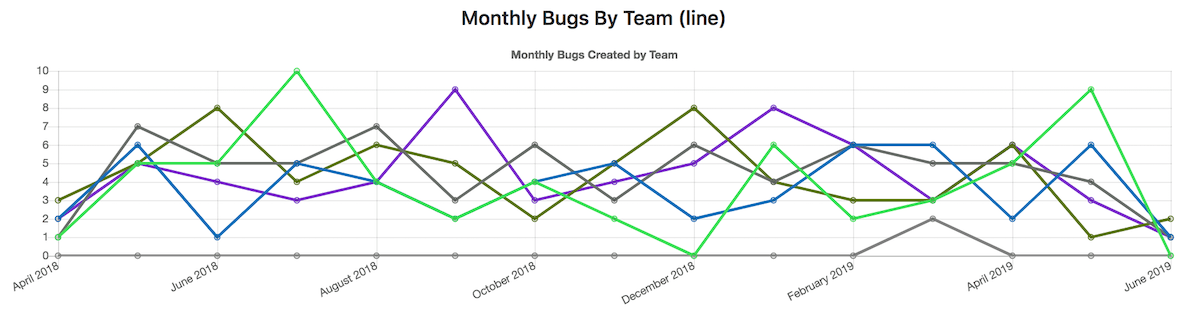 |
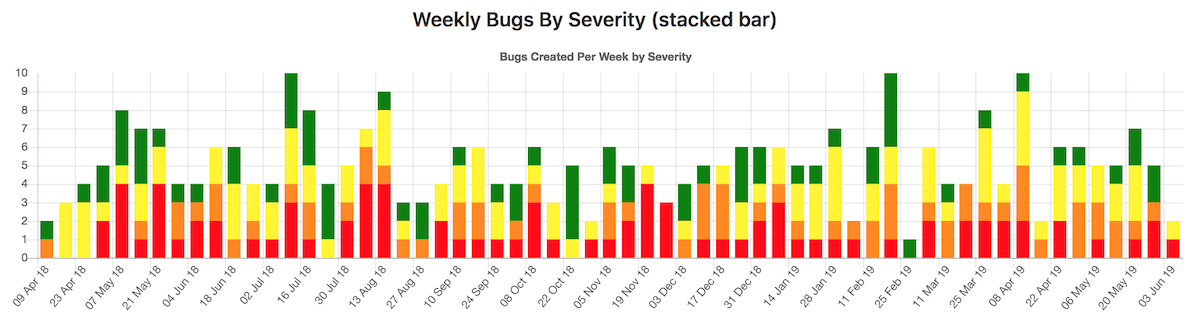
stacked-bar |
 |
NOTE:
The dora data source supports the bar and line chart types.
query
query allows to define the data source and various filtering conditions for the chart.
Example:
monthlyBugsCreated:
  title: "Monthly bugs created"
  description: "Open bugs created per month"
  type: bar
  query:
    data_source: issuables
    params:
      issuable_type: issue
      issuable_state: opened
      filter_labels:
        - bug
      collection_labels:
        - S1
        - S2
        - S3
        - S4
      group_by: week
      period_limit: 104
The legacy format without the data_source parameter is still supported:
monthlyBugsCreated:
  title: "Monthly bugs created"
  description: "Open bugs created per month"
  type: bar
  query:
    issuable_type: issue
    issuable_state: opened
    filter_labels:
      - bug
    collection_labels:
      - S1
      - S2
      - S3
      - S4
    group_by: week
    period_limit: 104
query.data_source
Introduced in GitLab 15.3.
The data_source parameter was introduced to allow visualizing data from different data sources.
Supported values are:
-
issuables: Exposes merge request or issue data. -
dora: Exposes DORA metrics data.
Issuable query parameters
query.params.issuable_type
Defines the type of "issuable" you want to create a chart for.
Supported values are:
-
issue: The chart displays issues' data. -
merge_request: The chart displays merge requests' data.
query.params.issuable_state
Filter by the current state of the queried "issuable".
By default, the opened state filter is applied.
Supported values are:
-
opened: Open issues / merge requests. -
closed: Closed Open issues / merge requests. -
locked: Issues / merge requests that have their discussion locked. -
merged: Merged merge requests. -
all: Issues / merge requests in all states
query.params.filter_labels
Filter by labels currently applied to the queried "issuable".
By default, no labels filter is applied. All the defined labels must be currently applied to the "issuable" in order for it to be selected.
Example:
monthlyBugsCreated:
  title: "Monthly regressions created"
  type: bar
  query:
    data_source: issuables
    params:
      issuable_type: issue
      issuable_state: opened
      filter_labels:
        - bug
        - regression
query.params.collection_labels
Group "issuable" by the configured labels.
By default, no grouping is done. When using this keyword, you need to
set type to either line or stacked-bar.
Example:
weeklyBugsBySeverity:
  title: "Weekly bugs by severity"
  type: stacked-bar
  query:
    data_source: issuables
    params:
      issuable_type: issue
      issuable_state: opened
      filter_labels:
        - bug
      collection_labels:
        - S1
        - S2
        - S3
        - S4
query.group_by
Define the X-axis of your chart.
Supported values are:
-
day: Group data per day. -
week: Group data per week. -
month: Group data per month.
query.period_limit
Define how far "issuables" are queried in the past (using the query.period_field).
The unit is related to the query.group_by you defined. For instance if you
defined query.group_by: 'day' then query.period_limit: 365 would mean
"Gather and display data for the last 365 days".
By default, default values are applied depending on the query.group_by
you defined.
query.group_by |
Default value |
|---|---|
day |
30 |
week |
4 |
month |
12 |
query.period_field
Define the timestamp field used to group "issuables".
Supported values are:
-
created_at(default): Group data using thecreated_atfield. -
closed_at: Group data using theclosed_atfield (for issues only). -
merged_at: Group data using themerged_atfield (for merge requests only).
The period_field is automatically set to:
-
closed_atifquery.issuable_stateisclosed -
merged_atifquery.issuable_stateismerged -
created_atotherwise
NOTE:
Until this bug, is resolved,
you may see created_at in place of merged_at. created_at is used instead.
DORA query parameters
Introduced in GitLab 15.3.
An example DORA chart definition:
dora:
  title: "DORA charts"
  charts:
    - title: "DORA deployment frequency"
      type: bar # or line
      query:
        data_source: dora
        params:
          metric: deployment_frequency
          group_by: day
          period_limit: 10
      projects:
        only:
          - 38
    - title: "DORA lead time for changes"
      description: "DORA lead time for changes"
      type: bar
      query:
        data_source: dora
        params:
          metric: lead_time_for_changes
          group_by: day
          environment_tiers:
            - staging
          period_limit: 30
query.metric
Defines which DORA metric to query. The available values are:
-
deployment_frequency(default) lead_time_for_changestime_to_restore_servicechange_failure_rate
The metrics are described on the DORA API page.
query.group_by
Define the X-axis of your chart.
Supported values are:
-
day(default): Group data per day. -
month: Group data per month.
query.period_limit
Define how far the metrics are queried in the past (default: 15). Maximum lookback period is 180 days or 6 months.
query.environment_tiers
An array of environments to include into the calculation (default: production). Available options: production, staging, testing, development, other.
projects
Introduced in GitLab 12.4.
You can limit where the "issuables" can be queried from:
- If
.gitlab/insights.ymlis used for a group's insights, withprojects, you can limit the projects to be queried. By default, all projects currently under the group are used. - If
.gitlab/insights.ymlis used for a project's insights, specifying any other projects yields no results. By default, the project itself is used.
projects.only
The projects.only option specifies the projects which the "issuables"
should be queried from.
Projects listed here are ignored when:
- They don't exist.
- The current user doesn't have sufficient permissions to read them.
- They are outside of the group.
In the following insights.yml example, we specify the projects
the queries are used on. This example is useful when setting
a group's insights:
monthlyBugsCreated:
  title: "Monthly bugs created"
  description: "Open bugs created per month"
  type: bar
  query:
    data_source: issuables
    params:
      issuable_type: issue
      issuable_state: opened
      filter_labels:
        - bug
  projects:
    only:
      - 3                         # You can use the project ID
      - groupA/projectA           # Or full project path
      - groupA/subgroupB/projectC # Projects in subgroups can be included
      - groupB/project            # Projects outside the group will be ignored
Complete example
.projectsOnly: &projectsOnly
  projects:
    only:
      - 3
      - groupA/projectA
      - groupA/subgroupB/projectC

bugsCharts:
  title: "Charts for bugs"
  charts:
    - title: "Monthly bugs created"
      description: "Open bugs created per month"
      type: bar
      <<: *projectsOnly
      query:
        data_source: issuables
        params:
          issuable_type: issue
          issuable_state: opened
          filter_labels:
            - bug
          group_by: month
          period_limit: 24

    - title: "Weekly bugs by severity"
      type: stacked-bar
      <<: *projectsOnly
      query:
        data_source: issuables
        params:
          issuable_type: issue
          issuable_state: opened
          filter_labels:
            - bug
          collection_labels:
            - S1
            - S2
            - S3
            - S4
          group_by: week
          period_limit: 104

    - title: "Monthly bugs by team"
      type: line
      <<: *projectsOnly
      query:
        data_source: issuables
        params:
          issuable_type: merge_request
          issuable_state: opened
          filter_labels:
            - bug
          collection_labels:
            - Manage
            - Plan
            - Create
          group_by: month
          period_limit: 24