Incidents (FREE)
An incident is a service disruption or outage that needs to be restored urgently. Incidents are critical in incident management workflows. Use GitLab to triage, respond, and remediate incidents.
Incidents list
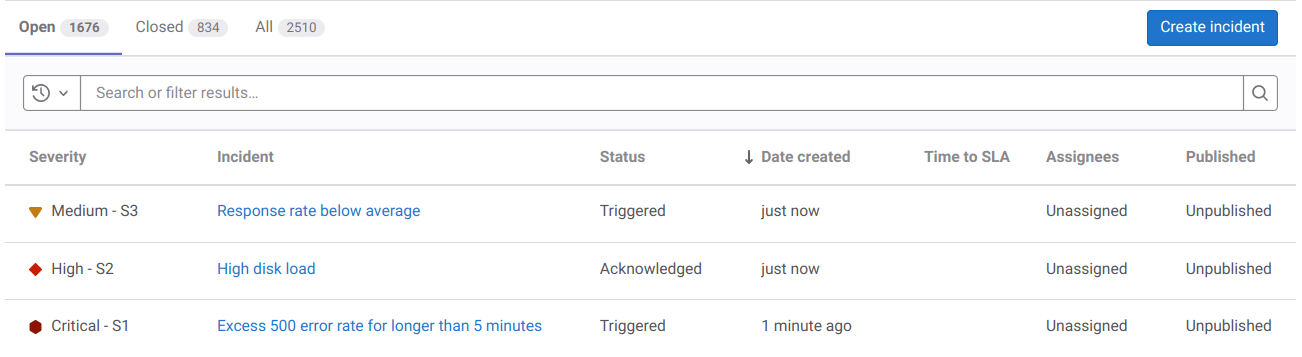
When you view the incidents list, it contains the following:
-
State: To filter incidents by their state, select Open, Closed, or All above the incident list.
-
Search: Search for incident titles and descriptions or filter the list.
-
Severity: Severity of a particular incident, which can be one of the following values:
- {severity-critical} Critical - S1
- {severity-high} High - S2
- {severity-medium} Medium - S3
- {severity-low} Low - S4
- {severity-unknown} Unknown
-
Incident: The title of the incident, which attempts to capture the most meaningful information.
-
Status: The status of the incident, which can be one of the following values:
- Triggered
- Acknowledged
- Resolved
In the Premium or Ultimate tier, this field is also linked to on-call escalation for the incident.
-
Date created: How long ago the incident was created. This field uses the standard GitLab pattern of
X time ago. Hover over this value to see the exact date and time formatted according to your locale. -
Assignees: The user assigned to the incident.
-
Published: Whether the incident is published to a status page.
For an example of the incident list in action, see this demo project.
Sort the incident list
Introduced in GitLab 13.3: incidents are sorted by created date by default.
The incident list shows incidents sorted by incident created date, showing the newest first.
To sort by another column, or to change the sorting order, select the column.
The columns you can sort by:
- Severity
- Status
- Time to SLA
- Published
Filter the incidents list
To filter the incident list by author or assignee, enter these values in the search box.
Incident details
Summary
The summary section for incidents provides critical details about the incident and the contents of the issue template (if selected). The highlighted bar at the top of the incident displays from left to right:
- The link to the original alert.
- The alert start time.
- The event count.
Below the highlight bar, a summary includes the following fields:
- Start time
- Severity
full_query- Monitoring tool
The incident summary can be further customized using GitLab Flavored Markdown.
If an incident is created from an alert that provided Markdown for the incident, then the Markdown is appended to the summary. If an incident template is configured for the project, then the template content is appended at the end.
Comments are displayed in threads, but can be displayed chronologically by toggling on the recent updates view.
When you make changes to an incident, GitLab creates system notes and displays them below the summary.
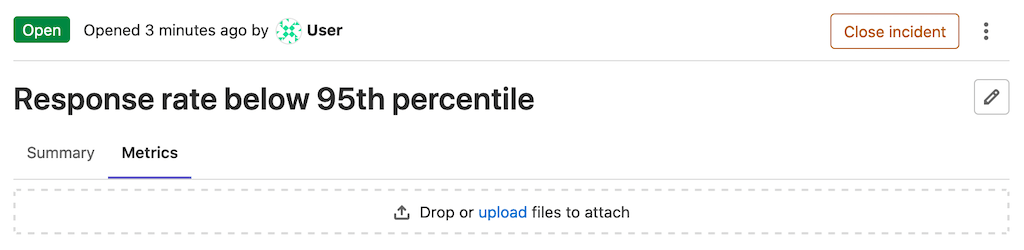
Metrics (PREMIUM)
Introduced in GitLab 13.8.
In many cases, incidents are associated to metrics. You can upload screenshots of metric charts in the Metrics tab:
When you upload an image, you can associate the image with text or a link to the original graph.
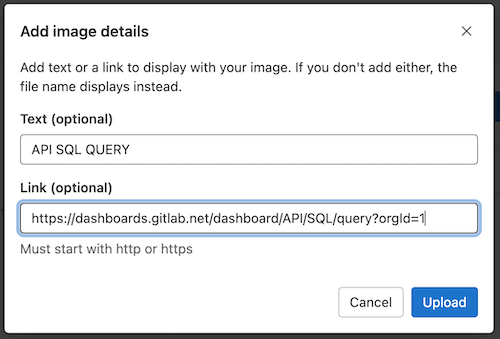
If you add a link, you can access the original graph by selecting the hyperlink above the uploaded image.
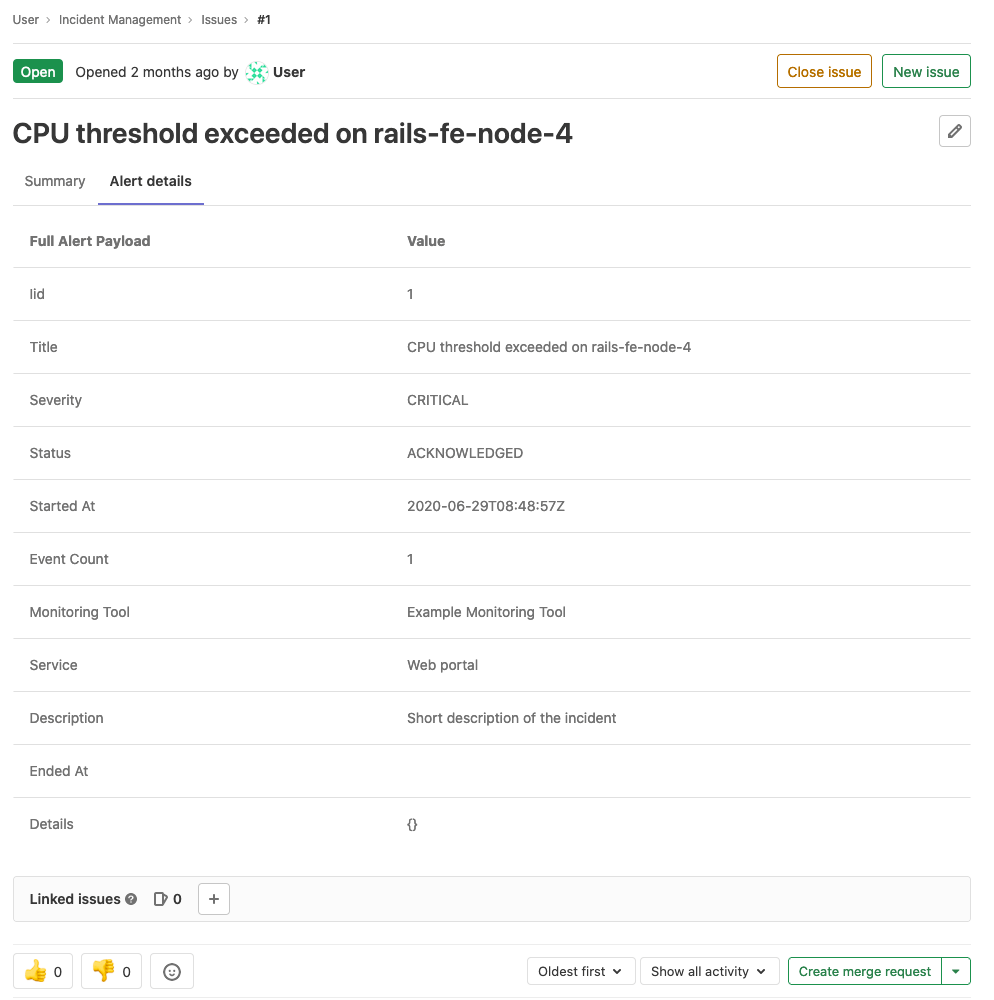
Alert details
Introduced in GitLab 13.4.
Incidents show the details of linked alerts in a separate tab. To populate this tab, the incident must have been created with a linked alert. Incidents created automatically from alerts have this field populated.
Timeline events
Incident timelines give a high-level overview of what happened during an incident, and the steps that were taken for it to be resolved.
Read more about timeline events and how to enable this feature.
Recent updates view (PREMIUM)
Introduced in GitLab 13.5.
To see the latest updates on an incident, select Turn recent updates view on ({history}) on the comment bar. Comments display un-threaded and chronologically, newest to oldest.
Service Level Agreement countdown timer (PREMIUM)
Introduced in GitLab 13.5.
You can enable the Service Level Agreement Countdown timer on incidents to track the Service Level Agreements (SLA) you hold with your customers. The timer is automatically started when the incident is created, and shows the time remaining before the SLA period expires. The timer is also dynamically updated every 15 minutes so you do not have to refresh the page to see the time remaining.
Prerequisites:
- You must have at least the Maintainer role for the project.
To configure the timer:
- On the top bar, select Main menu > Projects and find your project.
- On the left sidebar, select Settings > Monitor.
- Expand the Incidents section, then select the Incident settings tab.
- Select Activate "time to SLA" countdown timer.
- Set a time limit in increments of 15 minutes.
- Select Save changes.
After you enable the SLA countdown timer, the Time to SLA column is available in the
incidents list and as a field on new incidents. If
the incident isn't closed before the SLA period ends, GitLab adds a missed::SLA
label to the incident.
Related topics
- Create an incident
- Create an incident automatically whenever an alert is triggered
- View incidents list
- Assign to a user
- Change incident severity
- Change incident status
- Change escalation policy
- Embed metrics
- Close an incident
- Automatically close incidents via recovery alerts
- Add a to-do item
- Add labels
- Assign a milestone
- Make an incident confidential
- Set a due date
- Toggle notifications
- Track spent time
- Add a Zoom meeting to an incident the same way you add it to an issue
- Linked resources in incidents
- Create incidents and receive incident notifications directly from Slack
- Use the Issues API to interact with incidents